Computer Vision
at Scale.

Line detection was stuck at 28%. We swapped the U-Net
for a SAM 2.1 + DINOv3 + Mask2Former stack, served it
through NVIDIA Triton 25.x with TensorRT-LLM and
FP8 / FP4 quantisation, and pushed accuracy to 59%
and throughput 4.2×. 10K+ images a day, sub-3% variance.
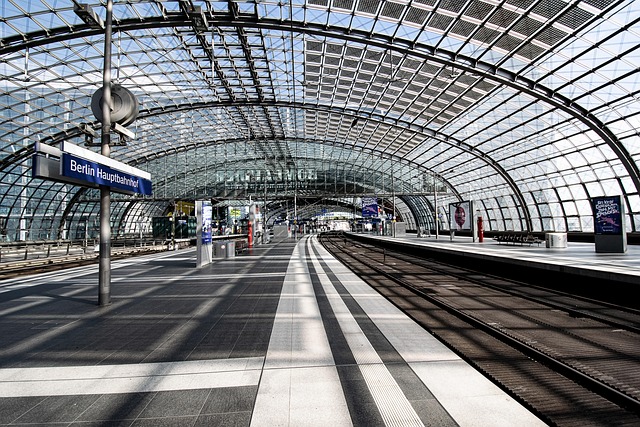
Aerial imagery roof measurement platform
We took line detection from 28% to 59% while pushing throughput 4.2×, and kept measurement variance under 3% against manual surveys. The pipeline now handles 10,000+ images a day across 2,500 roof assessments — served on Hopper / Blackwell GPUs in FP8 / FP4 with structured 2:4 sparsity.
SAM 2.1 prompt-segmentation handles the heavy lifting, a DINOv3 backbone with a Mask2Former head does the dense pixel work, NVIDIA Triton 25.x serves them, TensorRT-LLM with FP8 / FP4 quantisation, 2:4 sparsity and a distilled student model squeeze the GPU budget. Model wins only count if inference holds under load, and this one does.
AI Delivery Approach
-
Error analysis before training — We triaged failure cases on real aerial imagery first and targeted the line-detection gaps that actually moved measurement variance.
-
SAM 2.1 + DINOv3 + Mask2Former — We replaced the bare U-Net with a SAM 2.1 prompted-segmentation front and a DINOv3 backbone + Mask2Former head, then quantised to FP8 (Hopper) / FP4 (Blackwell) and added 2:4 structured sparsity — throughput went up, precision stayed where it counts.
-
Triton 25.x in production — We packaged the models for NVIDIA Triton 25.x via TensorRT-LLM with dynamic batching, model ensembling and a distilled student fast-path, so peak-hour bursts don’t blow the latency budget.
-
Canary and watch — We rolled it out behind a canary with accuracy and latency SLOs. Downstream measurement systems saw no regression, just more throughput.
What was actually hard
Aerial inputs swing wildly — sun angle, shadow, resolution, shingle style. A model that worked on one region quietly failed on another, and the throughput target ruled out a heavy ensemble. We had to push accuracy up and latency down at the same time, and keep Triton serving stable when the batch shape changed underneath it.
Project Outcome
Line detection went from 28% to 59% and the pipeline held throughput under production load. Downstream measurement systems started trusting the signal enough to drop their manual reconciliation step, and the team now ships model updates without an architecture rewrite.
accuracy > 4.2× throughput
improvement > 10K+ images
per day > <3% measurement
variance

“Model accuracy doubled and inference stayed fast under production load. The NVIDIA Triton deployment surprised us — we went from prototype to scale without a single architecture rewrite.”
@ Mark T.
CTO — Aerial Analytics Company
More Case Studies